Cape Town, by the water.
Same dams. Less water.
The big six are at 73.0% capacity. A year ago, they were at 87.4%. Here’s what that gap means.
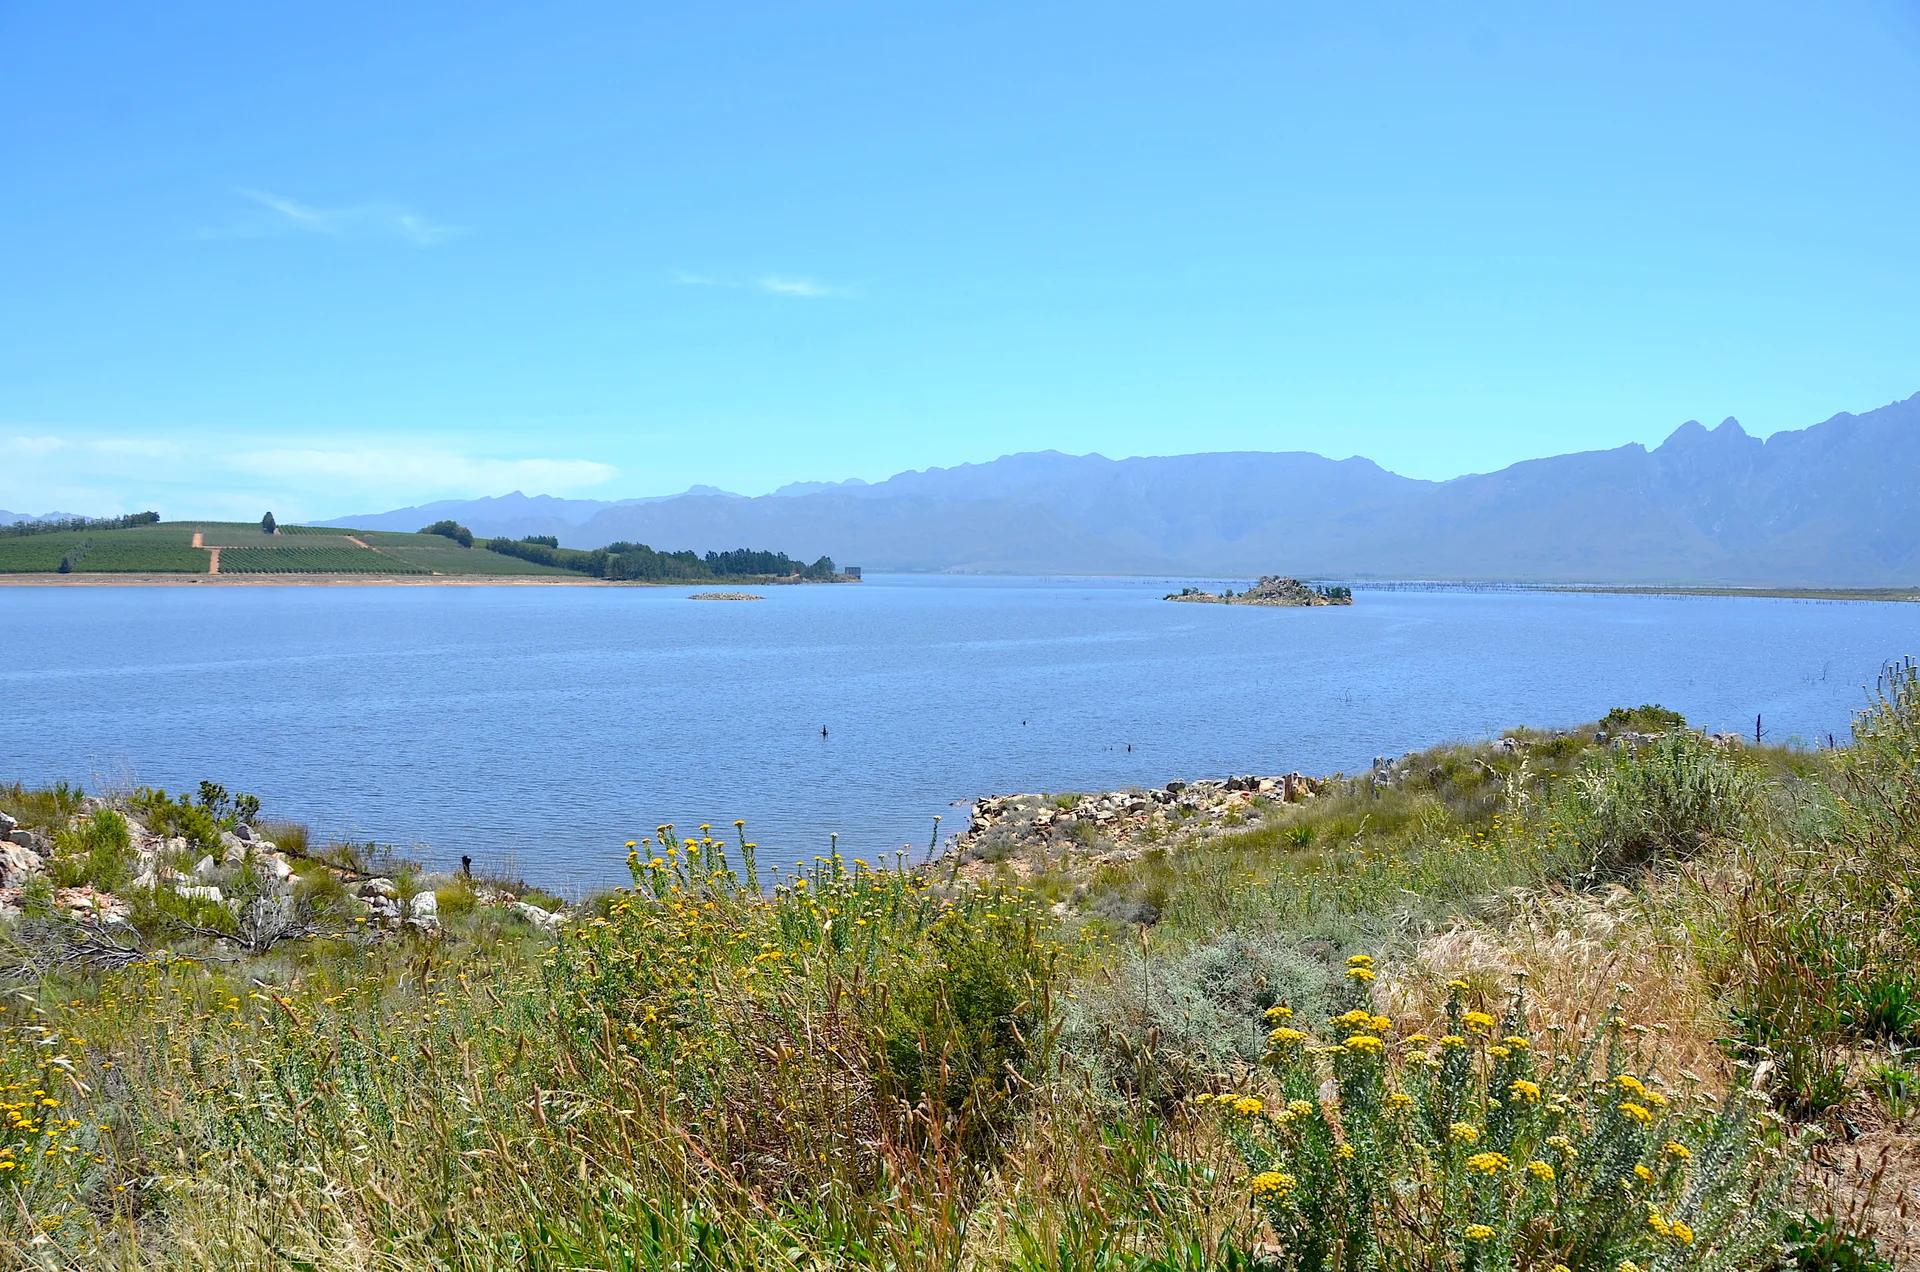
Theewaterskloof Dam, 4 November 2019. Olga Ernst / CC BY-SA 4.0. Resized and cropped for display. Archive image; the readings below are from 2 November 2026.
Published 6 November 2026, 09:00 SAST
READINGS / 2 November 2026
01 / THE BIG PICTURE
A gap you can see.
Combined storage across Cape Town’s six major supply dams. The same week, a year apart.
This year
2 November 2026Last year
Same week in 202514.4percentage points
below the same week last year
655 647 ML stored
of 898 221 ML capacity
Source: City of Cape Town weekly dam table, 2 November 2026. Each column uses the same 0–100% scale.
THE SHORT READ
If you’ve been eyeing the dam in the distance on a Winelands drive and wondering whether it looks lower than last year: it does. The six major dams that supply Cape Town held 73.0% of their capacity on 2 November — 655,647 megalitres of a possible 898,221. The same week last year, the City’s table read 87.4%.
That’s a drop of more than fourteen percentage points in twelve months. Two dams carry most of the story: Voëlvlei is at 55.0%, down from 97.4% a year ago, and Steenbras Lower is at 47.3% after 89.9% last year. Steenbras Upper, meanwhile, is nearly full at 98.3%. (All figures: City of Cape Town weekly dam table, 2 November 2026.)
02 / BEHIND THE COMBINED NUMBER
Every dam has its own story.
The combined figure hides some very different levels. These are the dams highlighted in this week’s briefing.
Voëlvlei
42.4 ppSteenbras Lower
42.6 ppStorage as a percentage of each dam’s own capacity. Bars run from 0% to 100%. “pp” means percentage points. City table: 2 November 2026.
03 / LIFE AROUND THE WATER
What it means for your weekend.
Small choices at home. A little homework before a day out.
Around the house.
Keep daily use in check.
No water restrictions are in place — they haven’t been since 1 November 2020 — but the City’s water status sits at “Early Drought Caution” and its collective target is less than 860 million litres a day across the city. The City’s own line, checked 2 November: rainfall has been lower than expected and the risk of restrictions has increased. (City of Cape Town water restrictions page, checked 2 November 2026.)
In the garden and the pool.
Put the pool cover back on.
The permanent water-saving regulations apply regardless of drought status — the ones that survived Day Zero-era habit changes. If your pool cover came out for summer, this is the week it goes back on. (City of Cape Town, permanent water use regulations, current on 2 November 2026.)
Dam day-trips.
Check access before the drive.
The big dams feed the city, not the braai — swimming and boating on the major supply dams are governed by their own rules, which change by dam and by season. If a dam stop is part of a Winelands or Overberg day out, check the authority for that dam before you plan around its shoreline. (See the City’s dam levels page for the dams’ role in the system; checked 2 November 2026.)
The season so far.
Keep an eye on the season.
This hydrological year has been a rollercoaster the City didn’t design: a May flood pushed dam levels up between 10% and 30% in a single week, then a below-normal winter drew the system back down. The City’s 2026 Water Outlook still finds no immediate risk to supply — but it flags demand growth and delayed new-supply projects as the pressure points. (City of Cape Town Water Outlook, June 2026.)
READ THE SOURCE
Check before you go.
These are CTIA summaries of City-published facts, each with its date above. For anything you’ll build a day around — a dam shoreline, a tariff change, a restriction update — check the City’s own pages on the day.
How we read the numbers- 01City of Cape Town — this week’s dam levels
2 November 2026
- 02City of Cape Town — water restrictions explained
checked 2 November 2026
- 03
- 04