Cape Town, by the water.
A steady drop. A wider gap.
The big six are at 71.7% capacity. A year ago, they were at 85.4%. Here’s what that gap means.
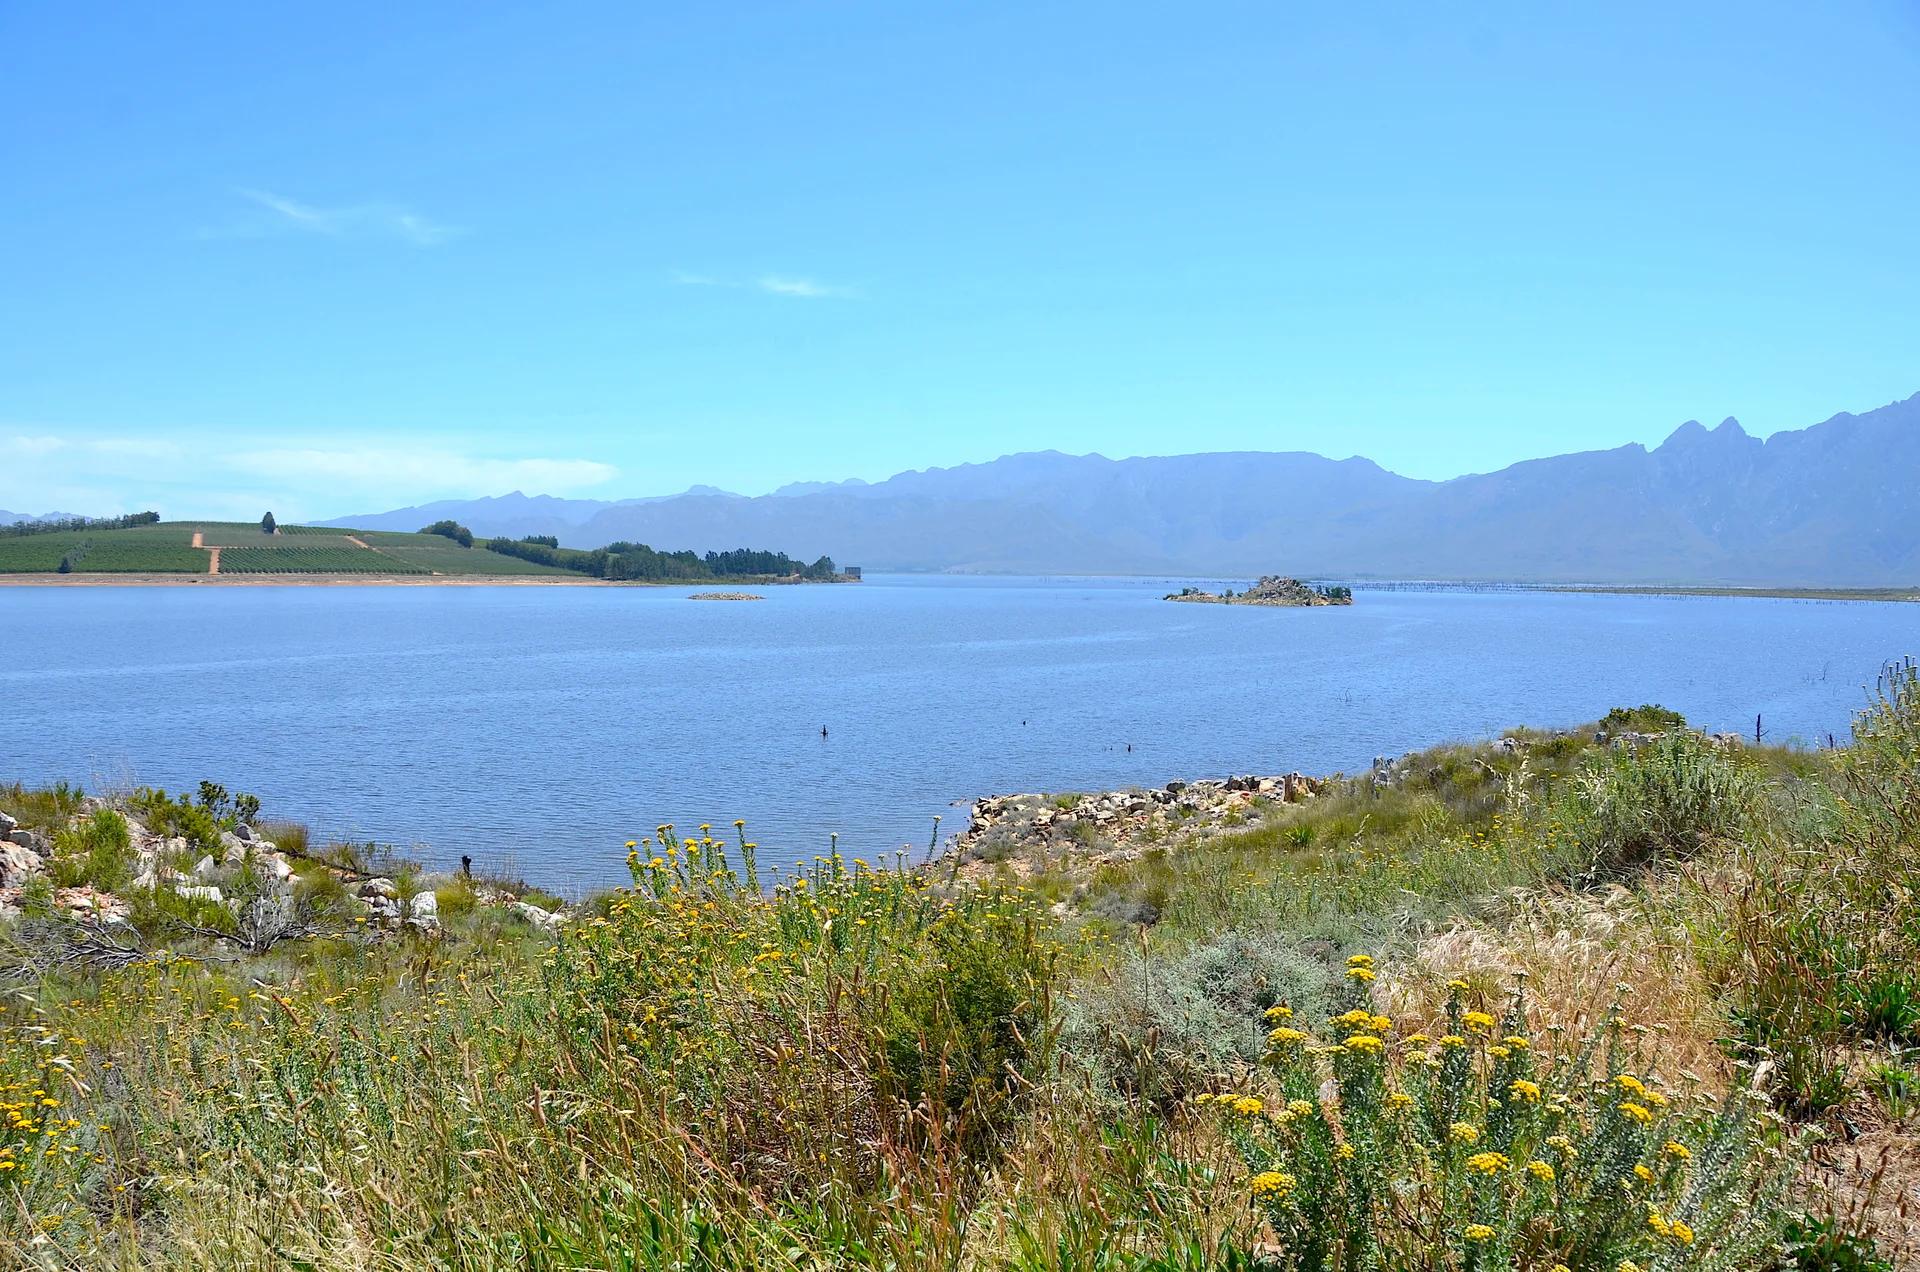
Theewaterskloof Dam, 4 November 2019. Olga Ernst / CC BY-SA 4.0. Resized and cropped for display. Archive image; the readings below are from 9 November 2026.
Published 16 November 2026
READINGS / 9 November 2026
01 / THE BIG PICTURE
A gap you can see.
Combined storage across Cape Town’s six major supply dams. The same week, a year apart.
This year
9 November 2026Last year
Same week in 202513.7percentage points
below the same week last year
644 353 ML stored
of 898 221 ML capacity
Source: City of Cape Town weekly dam table, 9 November 2026. Each column uses the same 0–100% scale.
THE SHORT READ
The City’s latest weekly table puts the six major supply dams at 71.7% of combined capacity on 9 November: 644,353 megalitres stored out of 898,221. That is 1.4 percentage points below the previous week’s 73.1%.
Against the same week in 2025, the combined figure is 13.7 percentage points lower than 85.4%. The change varies by dam: Voëlvlei is at 53.0%, compared with 96.1% a year earlier, and Steenbras Lower is at 46.7%, compared with 85.3%. Steenbras Upper is the exception, at 100.6% versus 99.1%. These are each dam’s levels as a share of its own capacity; the City reports Steenbras Upper above 100%.
02 / BEHIND THE COMBINED NUMBER
Every dam has its own story.
The combined figure hides some very different levels. These are the dams highlighted in this week’s briefing.
Berg River
1.0 pp lowerSteenbras Lower
38.6 pp lowerSteenbras Upper
1.5 pp higherTheewaterskloof
7.3 pp lowerVoëlvlei
43.1 pp lowerWemmershoek
5.0 pp lowerStorage as a percentage of each dam’s own capacity. Bars run from 0% to 100%. “pp” means percentage points. City table: 9 November 2026.
03 / LIFE AROUND THE WATER
What it means for your weekend.
Small choices at home. A little homework before a day out.
Around the house.
Keep daily use in check.
The City currently lists no water restrictions, while describing the resource status as Early Drought Caution. It asks residents to use water responsibly and sets a collective target of less than 860 million litres a day. Check the City’s page for changes before you make decisions based on restrictions.
In the garden and the pool.
Put the pool cover back on.
The City’s water guidance covers permanent regulations as well as temporary restrictions. Check the current rules before watering or topping up, and keep an eye on any City updates as the season changes.
Dam day-trips.
Check access before the drive.
A storage percentage does not tell you whether a shoreline is open or what activities are allowed. Check the relevant authority’s access and safety notices on the day before planning a stop.
The week in context.
Keep an eye on the season.
The weekly table is dated 9 November; the City’s daily page also lists a separate 12 November reading of 71.3%. Those figures describe different observation dates and reporting tables, so we keep them labelled rather than treating them as the same reading.
READ THE SOURCE
Check before you go.
This is a dated summary of the City’s weekly dam table for 9 November 2026. The Water Desk overview carries the newer daily reading when available; check the City’s pages for current levels, restrictions and access notices.
How we read the numbers- 01City of Cape Town — this week’s dam levels
weekly table: 9 November 2026
- 02City of Cape Town — water restrictions explained
checked 16 November 2026